Metagenomics data visualisation
Exploring optimal solutions for metagenomics data visualization
Functional profiles
This tool simplifies the postprocessing and visualisation of metagenomics functional profiles, generated by MOCAT or other processing pipelines. Currently it only supports KEGG orthologous groups, which are visualized through the interactive Pathways Explorer.
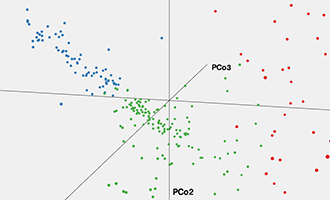
Taxonomic abundances
Use this tool to perform enterotyping on your metagenomics taxonomic abundance data and visualise the resulting PCoA (principal coordinates analysis) projection into 3D space.